


According to TrendForce’s analysis based on demand-side server shipment estimates, AI and server equipment shipments continue to grow strongly, and the power demand structure of data centers has already been reshaped by AI servers. In the short term, there is almost no uncertainty regarding the growth of AI servers and subsequent power capacity demand.
In the US, grid-deliverable capacity is not moving at the same pace, and by 2030 the distance between what the supply chain implies and what the grid can deliver is projected to exceed 170GW. The turn comes in 2028.
AI Servers Now Set the Data Center Power Budget
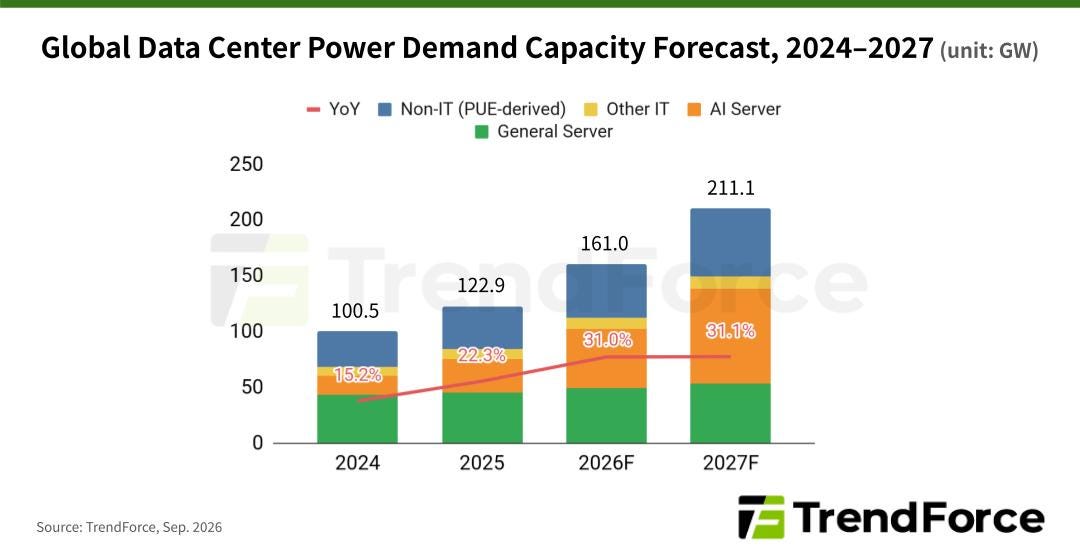
Global data center power demand capacity is projected to reach 161.0GW in 2026, up 31.0% YoY. This figure is expected to hit 211.1GW by 2027, sustaining a YoY growth rate of 31.1%. The largest growth driver? AI servers.
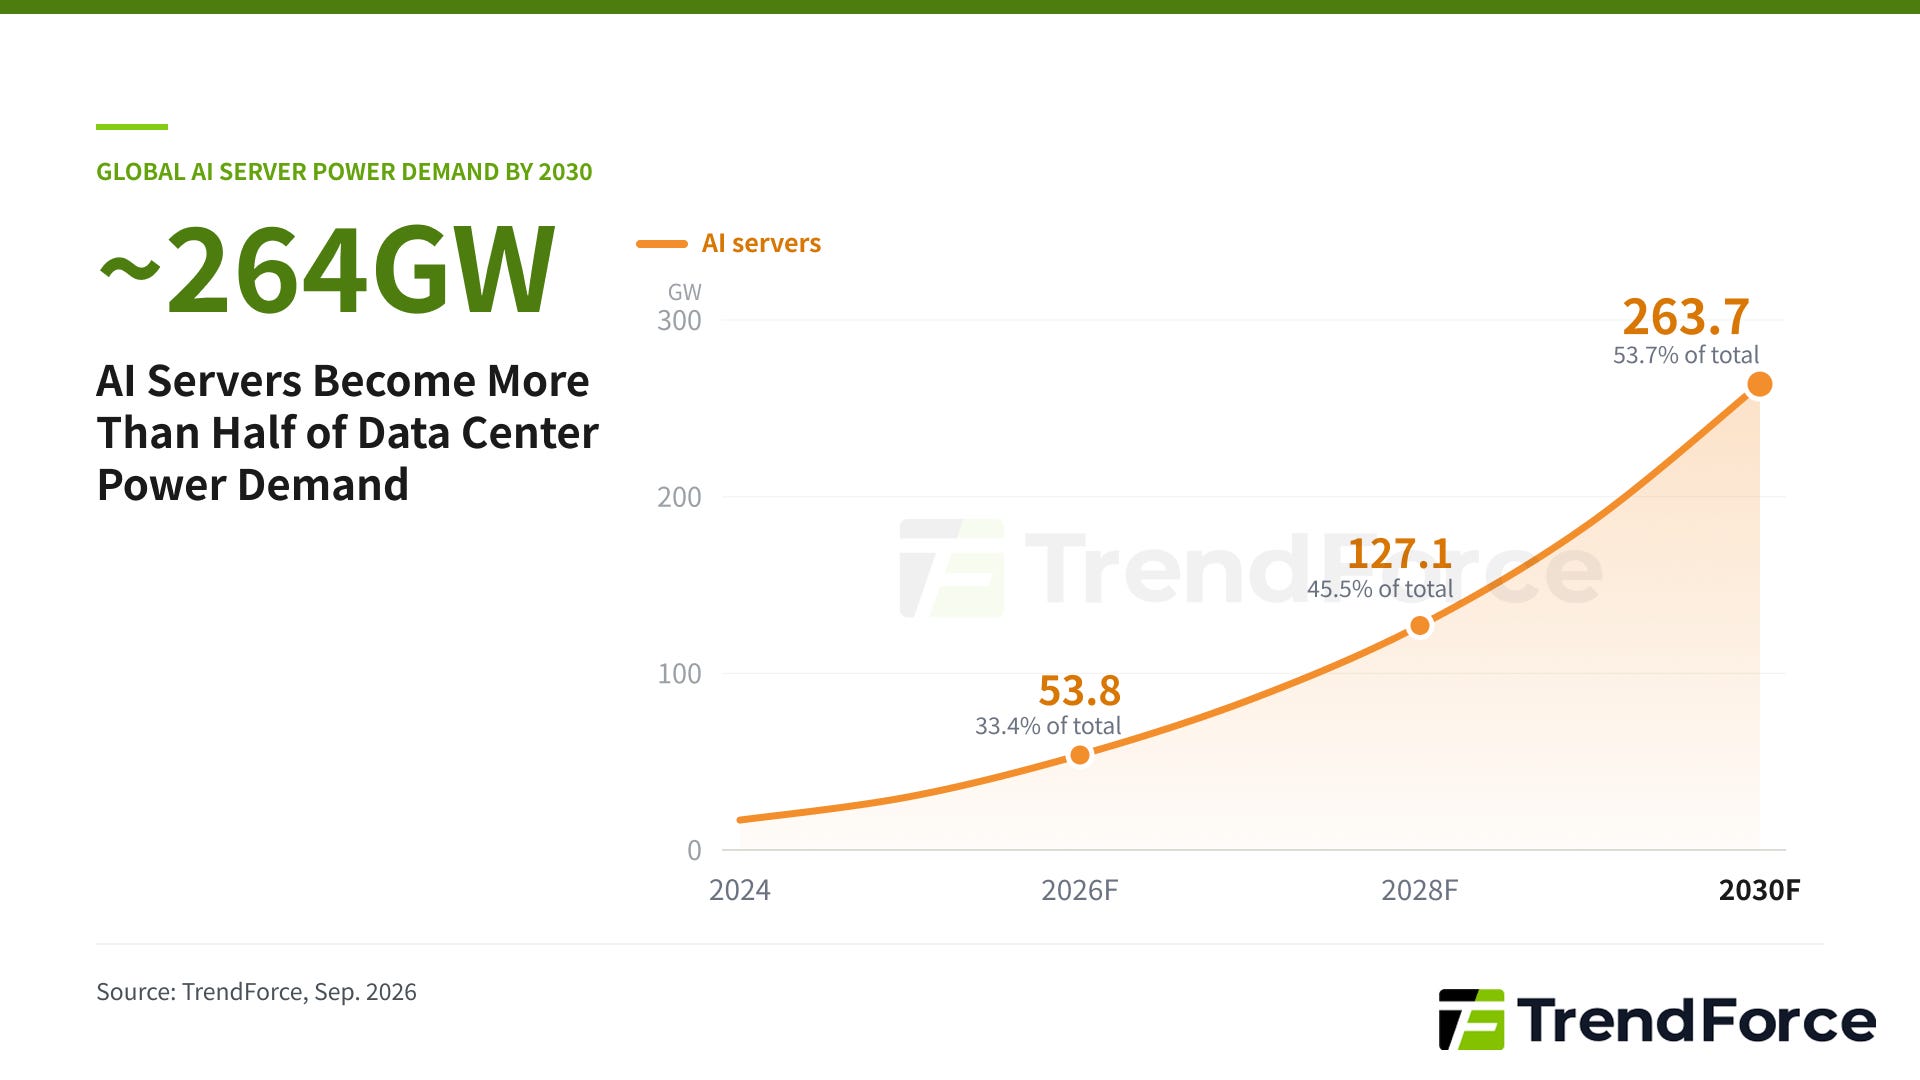
AI servers account for approximately 33.4% of total data center power demand capacity in 2026. That share could exceed 40% in 2027 and more than half (53.7%) by 2030. In absolute terms, AI server power demand capacity climbs from 53.8GW in 2026 to 127.1GW in 2028 and roughly 264GW in 2030, close to a fivefold increase in four years, against a 490.7GW global total.
General-purpose servers move the other way, with their share declining from around 40% historically to 25.6% in 2027, though in absolute power demand capacity they continue to exhibit growth, just far behind the much stronger growth shown by AI servers. Figures beyond 2027 are projections that rest on TrendForce’s AI chip and server shipment outlook and on the rising power draw of each new system generation.
Related report: Server Market Bulletin - Sep. 17, 2026
TrendForce notes that improvements to electrical and mechanical efficiency in data centers have reduced the additional facility load associated with each unit of IT power consumption. However, rapid deployment of IT equipment, led by AI servers, along with simultaneous growth in power demand from non-IT equipment, is prompting data center operators to begin planning for high-voltage direct current (HVDC) power architectures to improve end-to-end power distribution efficiency.
Demand and Delivery Separate after 2026, and the Gap Widens Greatly from 2028
Before 2025, the estimated data center power demand capacity and the actual power capacity that public grids could deliver closely tracked each other. However, supply and demand are expected to begin diverging in 2026, with the gap expected to widen significantly from 2028 onward.
By 2030, global data center power demand capacity is projected to hit 490.7GW, whereas the global grid-deliverable capacity will only reach 222.6GW (an upper bound that assumes grids outside the US fully deliver the data center demand), a gap of roughly 268GW.
TrendForce notes that this gap should be understood from two perspectives: First, data center electricity demand can be met not only by the grid but also through behind-the-meter (BTM), on-site generation developed by operators. Since this capacity is not included in estimates of grid capacity available to data centers, the calculated gap does not reflect the extent to which on-site generation could offset the shortfall. The headline gap may therefore be larger than the actual shortage.
Second, delays in grid interconnection and transmission and distribution infrastructure can create genuine power supply shortages.
In the US, which currently hosts the world’s largest concentration of data center deployments, a significant portion of data center demand through 2028 is expected to be grid-connected, with BTM emerging as an additional solution. Consequently, projects already planned for grid connection are likely to receive power on schedule.
However, after 2028, delays in grid power delivery are expected to become more frequent, substantially contributing to the growing gap between data center power supply and demand capacity. Setting TrendForce’s shipment-implied demand for the US, 272.4GW in 2030, against the 100.7GW that current grid data indicate can be delivered, the distance between the two will surpass 170GW by 2030. Whether this gap can be further reduced through additional behind-the-meter generation and grid power improvements remains uncertain.
How TrendForce Builds the Demand Line
The demand line does not start from announced campuses or utility filings. It starts from what the supply chain is shipping. TrendForce estimates server and AI chip shipments for each year, assigns each system generation its power draw, accumulates shipments into the fleet in service, totals the electricity that fleet consumes over a year, and converts it into power capacity. The reasoning is straightforward: a server that has been purchased will need power wherever it ends up, whether or not a grid connection is ready for it. Because TrendForce’s shipment data is global, the global total is then allocated to the US, China, and the rest of the world in proportion to the demand that public agencies forecast for each region. That places a little over half of the global total in the US, or 272.4GW in 2030.
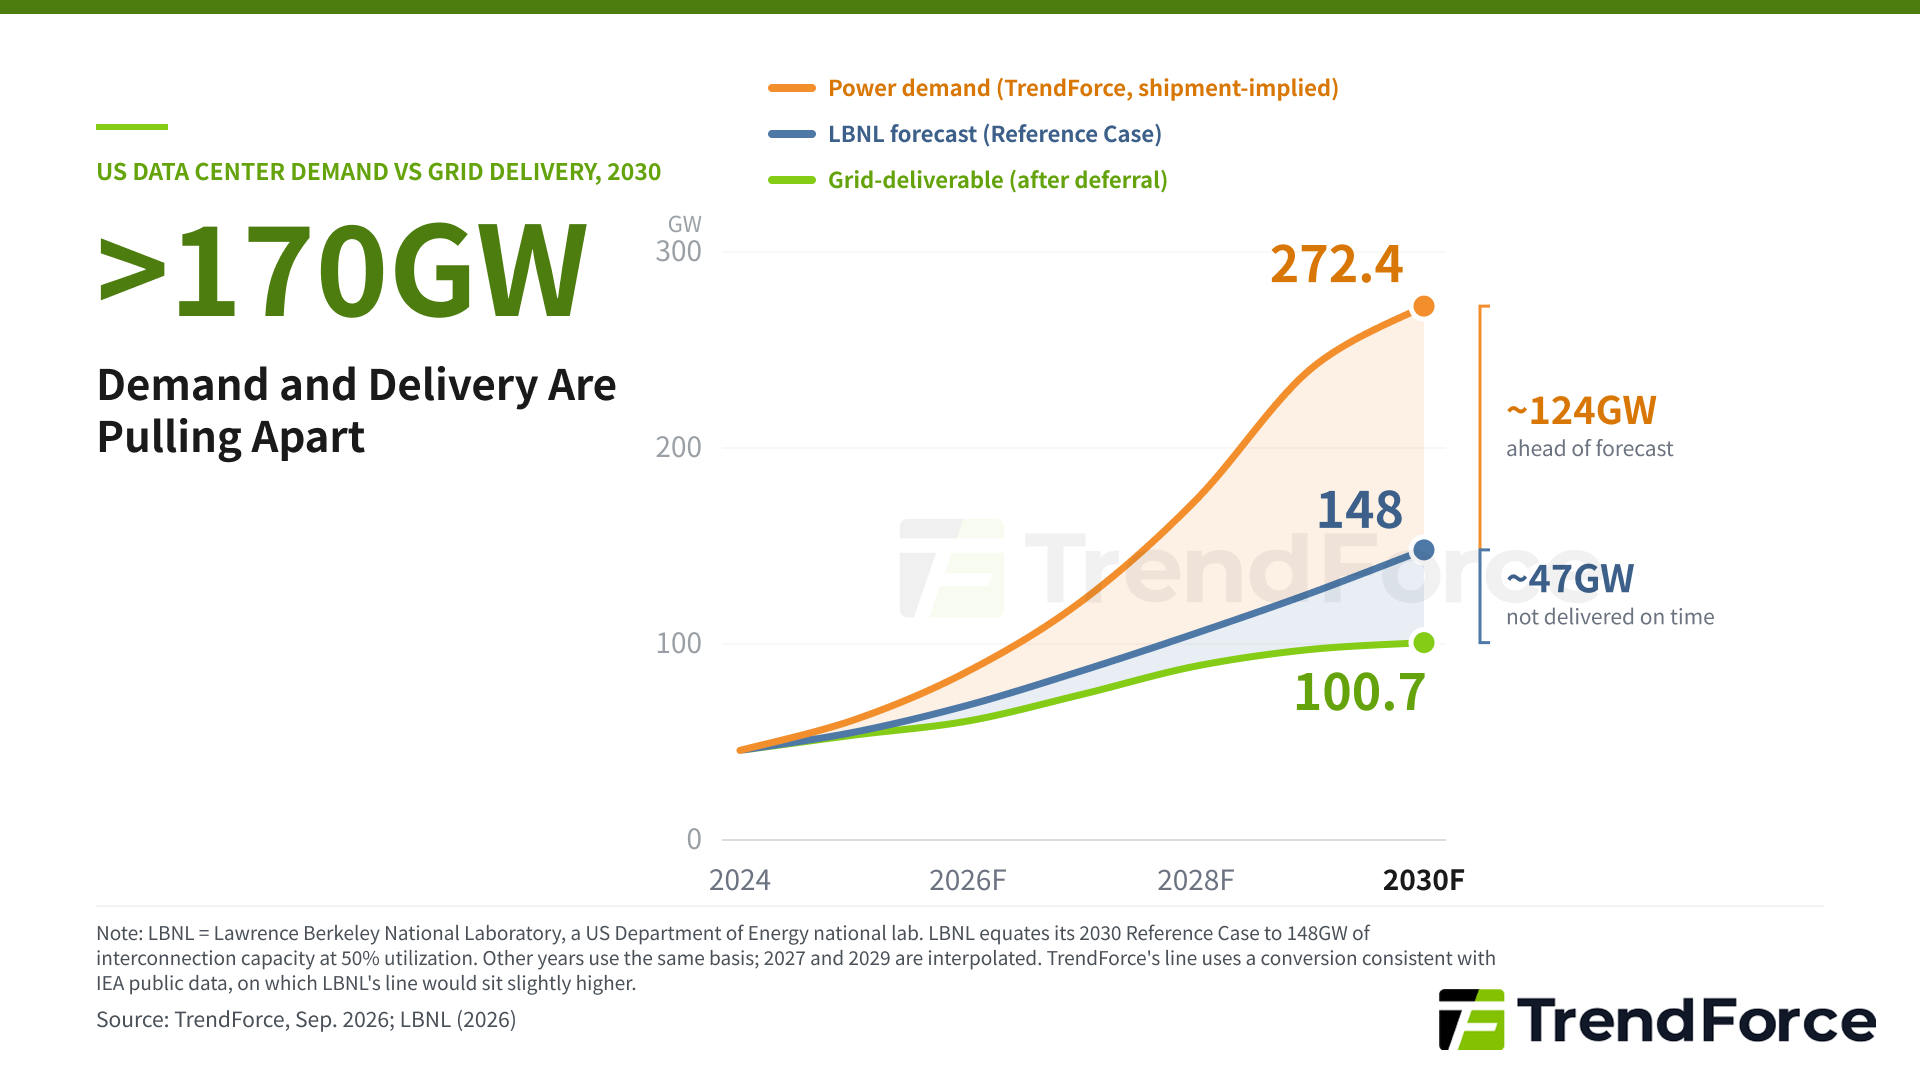
As a reference point, the chart above includes the Reference Case from Lawrence Berkeley National Laboratory (LBNL), a US Department of Energy national laboratory. LBNL projects electricity use, and it equates its 2030 projection to about 148GW of interconnection capacity. TrendForce’s demand line sits well above LBNL’s. The difference reflects TrendForce’s supply chain view of AI server shipments and of the power each new system generation draws. The 272.4GW should therefore be read as the demand implied by equipment purchases.
In 2030, the distance of more than 170GW between TrendForce’s demand line and the grid-deliverable line is made up of two layers. The upper layer, about 124GW, is the amount by which shipment-implied demand runs ahead of the LBNL forecast. It is not a grid shortfall. It is demand beyond what that forecast anticipates, and it will have to be met through faster grid expansion, behind-the-meter generation, or deployment outside the US, or it will slip in time.
Below the LBNL line lies the portion of demand that the grid is not expected to deliver on schedule. TrendForce estimates this at approximately 49GW, derived region by region from the public filings of grid operators and utilities. TrendForce will continue to track grid operators’ filings and update this estimate as they change.
(Note: The above chart shows this portion as roughly 47GW, the distance between the LBNL line and the grid-deliverable line. That the two figures land close together, despite being derived differently, serves as a check on both.)
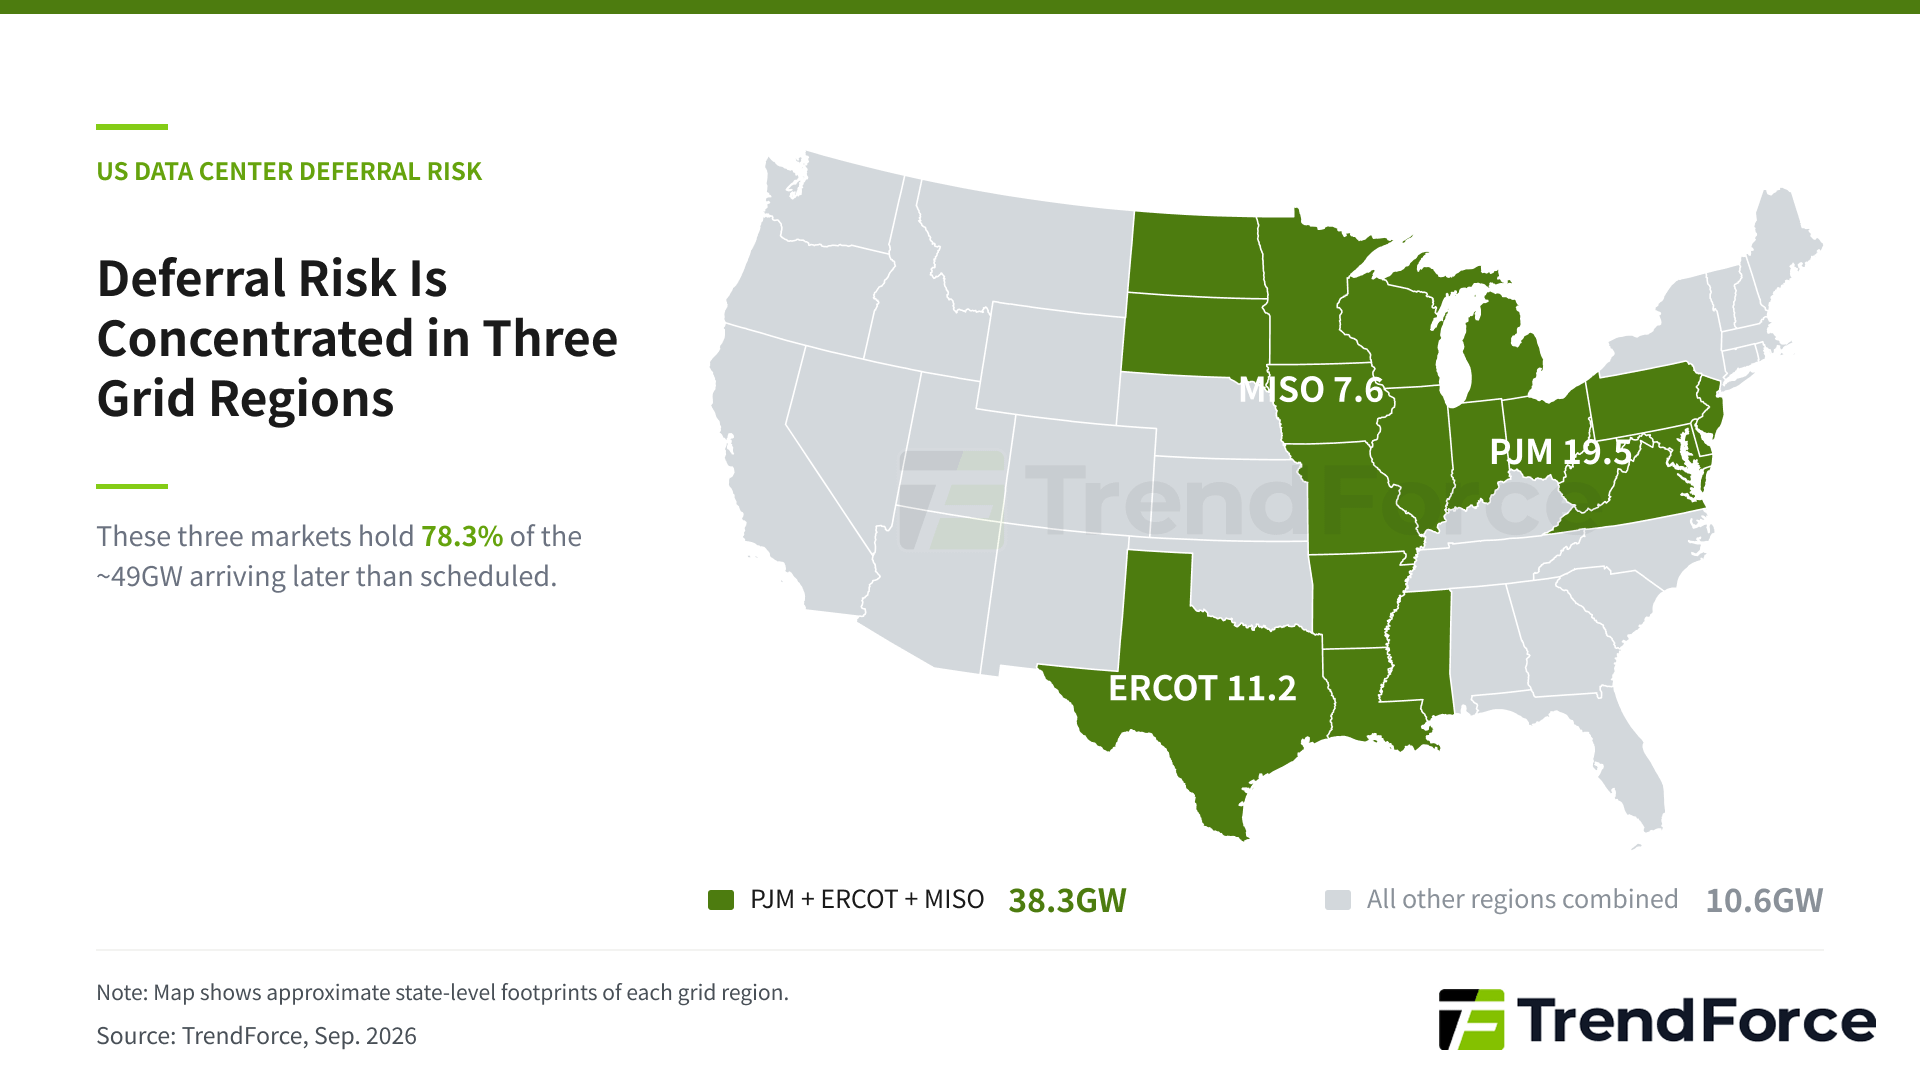
By region, PJM accounts for 19.5GW, ERCOT for 11.2GW, and MISO for 7.6GW, together representing 78.3% of the total. The deferral itself comes down to physical constraints: much of the US grid is aging, and the transmission, distribution and substation buildout needed to serve new load takes years to complete. These three markets are also where federal and state-level regulatory changes are most concentrated, and both phenomena point back to the same root cause: the volume of load interconnection requests has exceeded the speed at which existing rules, and the infrastructure behind them, can process them, prompting grid operators to pause and revise the rules before determining the order of energization.
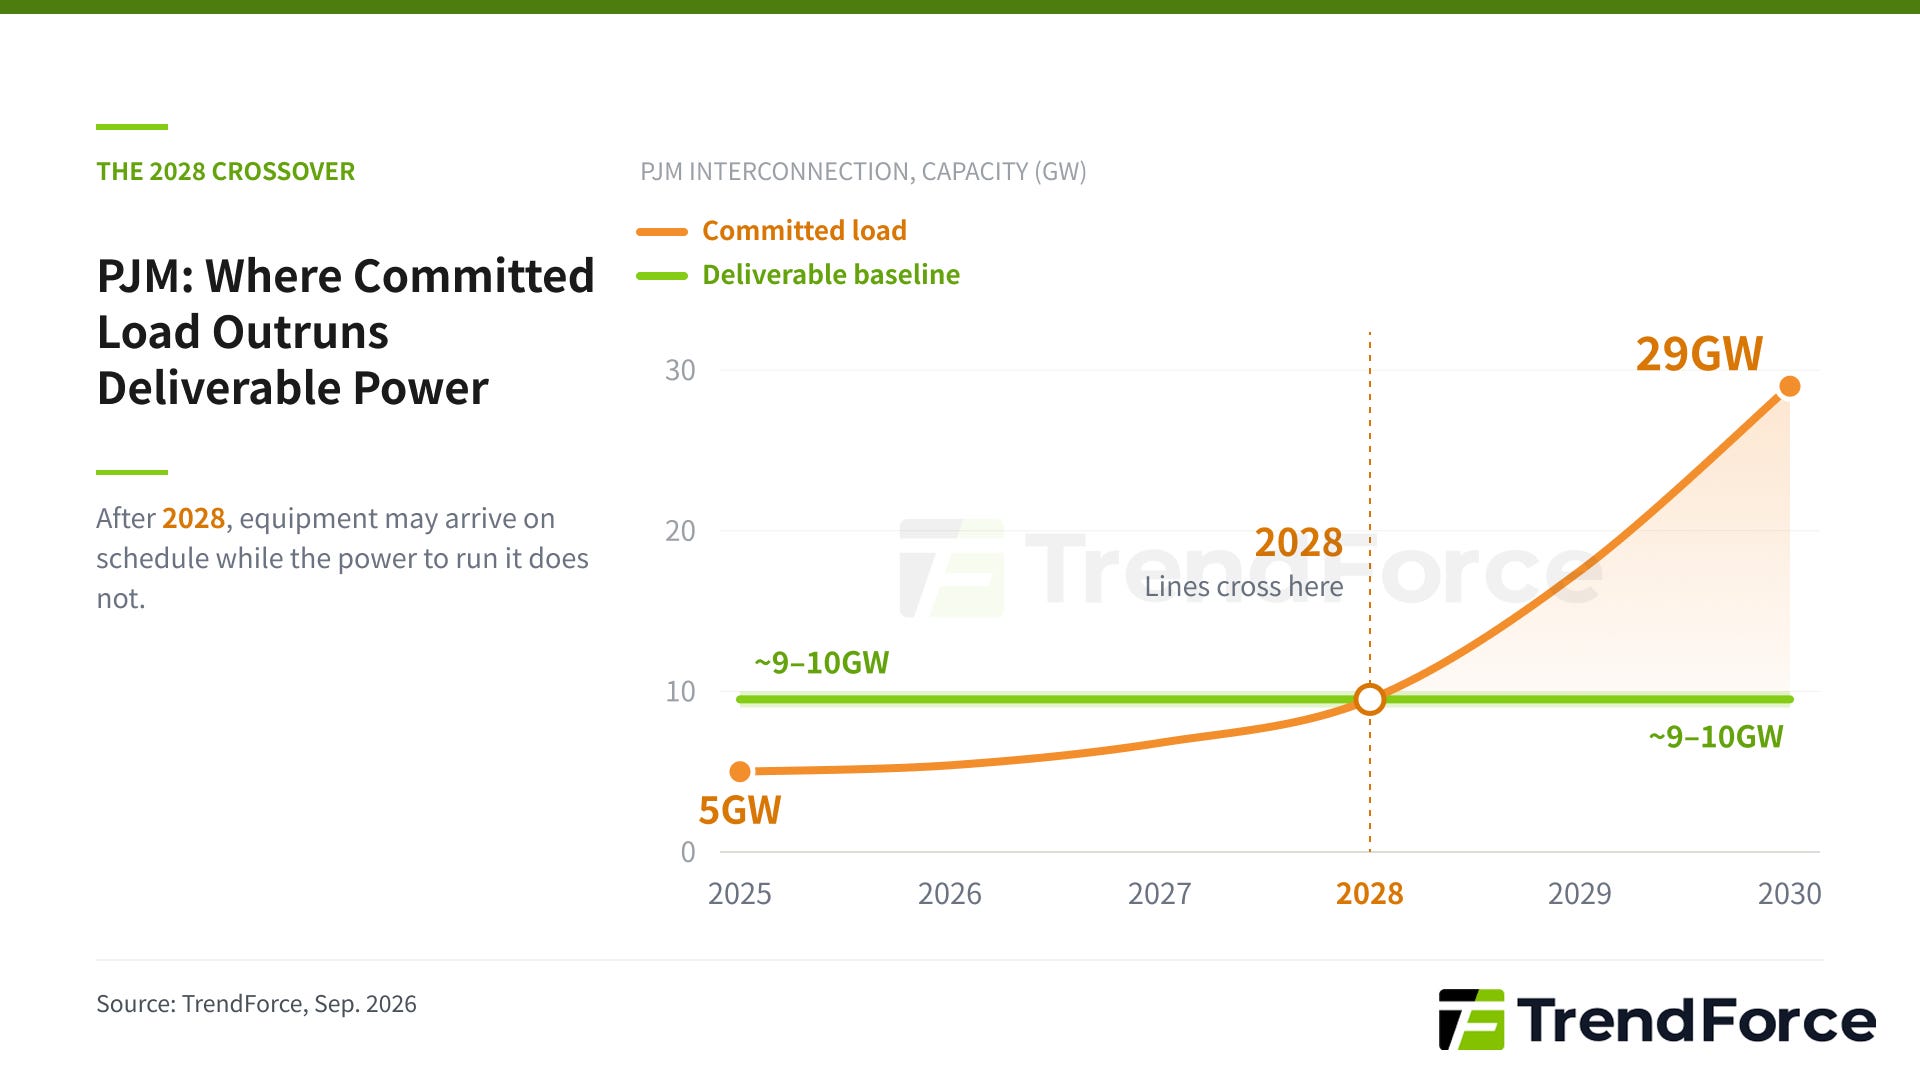
Currently, the risk of delay is concentrated after 2028. Taking PJM as an example, load growth on PJM’s books is projected to rise from 5GW in 2025 to 29GW in 2030, while the deliverable baseline only reaches 9-10GW over the same period. The two lines cross in 2028, meaning that the volume of delays in 2026 and 2027 is too small to alter procurement decisions for those years. It is only after 2028 that a scale mismatch risk may emerge, where equipment has already been deployed but power supply may not yet be available to match it.
US State Regulation Now Moving as Fast as the Build-out
Until 2025, US hyperscalers have navigated relatively clear regulatory pathways in each state, but those regulations themselves are now changing at an equally unprecedented pace.
Over the past six months, public sentiment in the US towards data centers has plummeted, and local opposition has become a tangible barrier to project development. With 36 states holding gubernatorial races and 35 Senate seats up for election in the 2026 midterms, data centers have emerged as a mainstream political issue, with negative sentiment surrounding the construction boom spanning across party lines, a rarity in US politics.
Even in Texas, the state most data-center friendly in the country, Governor Greg Abbott sent a letter on August 3 to ERCOT and regulatory agencies requesting an audit of every data center in the interconnection queue; ERCOT subsequently suspended the Batch Zero interconnection study, which covers approximately 250 to 300 projects, with the review expected to take several months. Pennsylvania Governor Josh Shapiro, previously a major supporter of data centers, signed an executive order on August 18 removing all data centers from the state’s fast-track permitting process and barring them from re-entering.
The fact that two of the more supportive states tightened their policies in the same month indicates that this is not an isolated case but a widespread phenomenon during the election year.
Hyperscalers are the most capable of adapting to these regulatory changes, but deferral risks will still be amplified, particularly for projects still in the permitting and planning stages that have not yet broken ground. With rising regulatory uncertainty, operators may increasingly rely on BTM self-generation, though such approach comes with its own challenges, one of which is the lead time for generators and transformers.
What We’re Watching
Over the next six months, a large number of data center-related regulatory proposals are likely to emerge, ranging from symbolic measures to those that could pose real deferral risks. TrendForce will continue to track interconnection timelines across PJM, ERCOT, and MISO, the pace of BTM self-generation adoption, and state-level regulatory developments following the 2026 midterms, as the clearest early signals of whether the gap narrows or widens further.
Disclaimer & Copyright Notice The information, analyses, and data contained in this article (the “Content”) are provided for informational and educational purposes only. The Content represents the independent research and analysis of TrendForce and should not be construed as financial, legal, tax, or investment advice, or as an offer or solicitation to buy or sell any securities or financial instruments. Investment decisions and their consequences rest solely with the reader; you should consult with a professional financial advisor before making any investment decisions.
All Content is proprietary to TrendForce. Unauthorized reproduction, copying, distribution, or redistribution of this Content, in whole or in part, without the express written consent of TrendForce is strictly prohibited.
Copyright © 2026 TrendForce. All rights reserved.